INTRODUCTION
For decades, IMPLAN has been the tool that economists and researchers turn to when they want to measure the impact of an economic event on a region. IMPLAN has long been trusted to deliver easy to use impact modeling, and extensive economic analytics.
Now, IMPLAN has developed Quick Start Guides, which make it possible for those without an economics background to perform economic impact analysis quickly and easily by following a series of prompts that appear on the screen inside the application.
OVERVIEW
Quick Start Guides are designed to make IMPLAN more accessible and intuitive for users that may not have much experience in completing economic impact analyses. Quick Start Guides provide a template for some of the most common IMPLAN use cases, with step-by-step prompts to guide users through all phases of setting up and running the Project. Currently, the Guide Library includes seven Quick Start Guides:
- Construction and Operations
- Impacts of Green Energy
- Existing Firm / Industry Contribution
- Tourism Impacts
- University Impacts
- Mixed Use Development
- Enterprise Impacts
Two additional Forward Linkage Quick Start Guides are available as an add-on product:
- Price Change (Cost-Push) Guide
- Downstream Industry Contribution Guide.
HOW TO ACCESS QUICK START GUIDES
To begin using the Construction and Operations Guide, select it from the Guides Carousel, or start by clicking the View More Guides button underneath the Guides widget on the IMPLAN Dashboard.
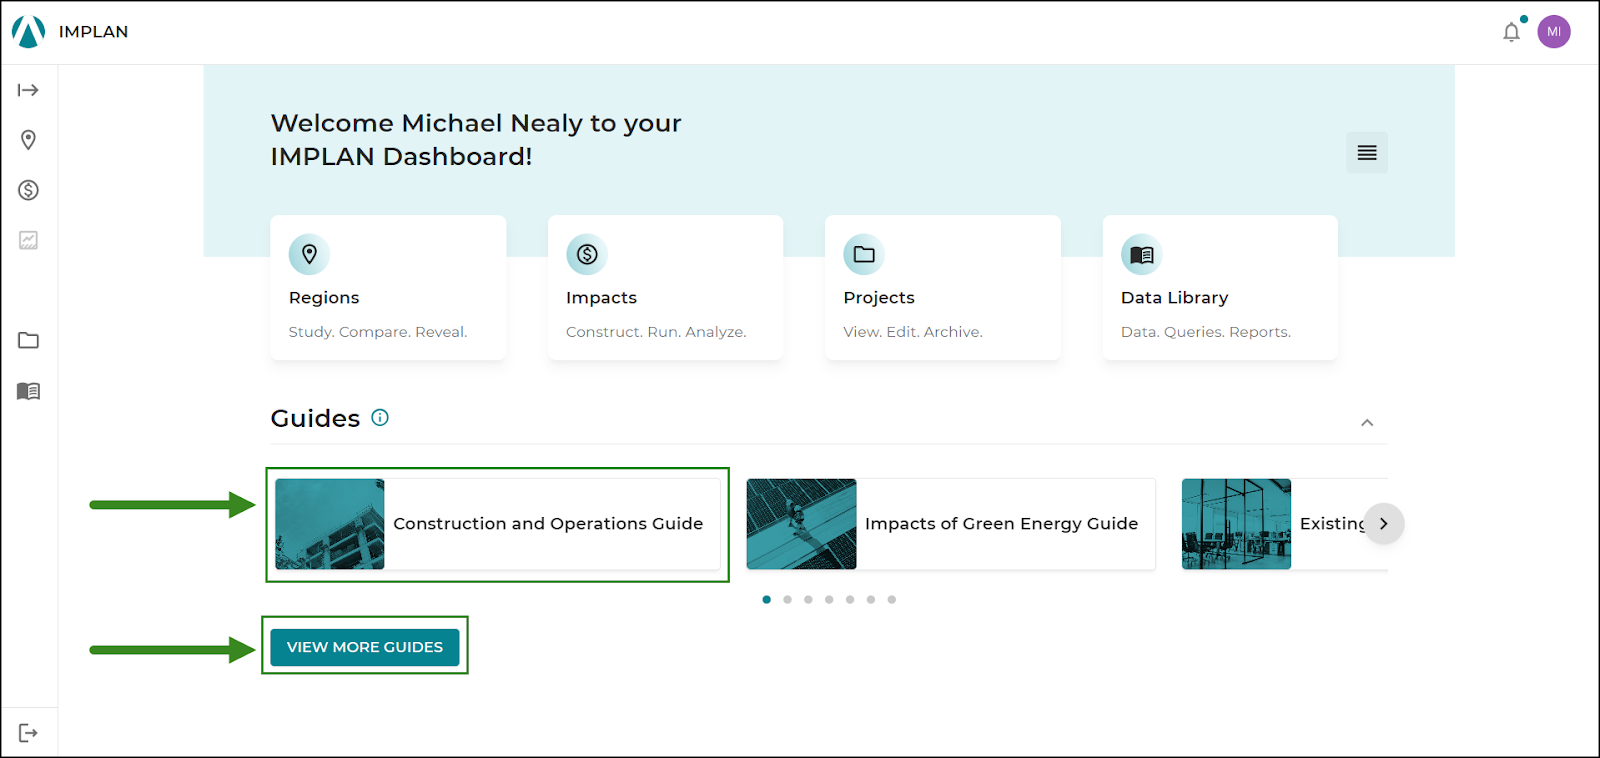
The Guides Carousel allows users to begin a guide without leaving the IMPLAN Dashboard by simply clicking on the name of the guide. Clicking View More Guides will bring users to the Guides Library, where each of the currently available guides can also be accessed. Click on the guide you would like to use in order to begin the Project.
Each guide will give additional information and considerations for when and how to appropriately use the selected guide.
USING THE QUICK START GUIDE
REGION
After clicking continue, the first step is to select the Region and Data Year. Select the Region by either clicking on the map or using the search. Use the Next or Back button to progress through the guide.
Enterprise Impacts Guide Regions
Before being taken to the Region page in the Enterprise Impacts Guide, users need to answer two questions. The first question asks the user if they would like to evaluate only the regions they select or if they would prefer a 51 state analysis. Additional information about these selections are included in the guide.
The second question asks the user if they would like to configure their events individually or bulk upload them using a template. If the user selects the configure individually option, they will be guided through the steps described in the Impacts section below. If the user selects the use a template option, they will create economic Event(s) in a template downloaded from within the guide.
After a user answers these questions and clicks next, they will be taken to the Region page. Users can select multiple Regions in this guide. After a user finishes selecting Regions and clicks next, if they opted for the template option, they will be taken to a page where they will download their template. The guide and template provide instructions on completing the template option.
If the user did not select the template option, they will complete the steps described in the following section.
IMPACTS
After selecting the Region and Data Year, each guide will include a series of steps that will create the economic Event(s) and allow users to provide inputs. Each step includes support resources, including considerations and best practices for the various options.
RESULTS
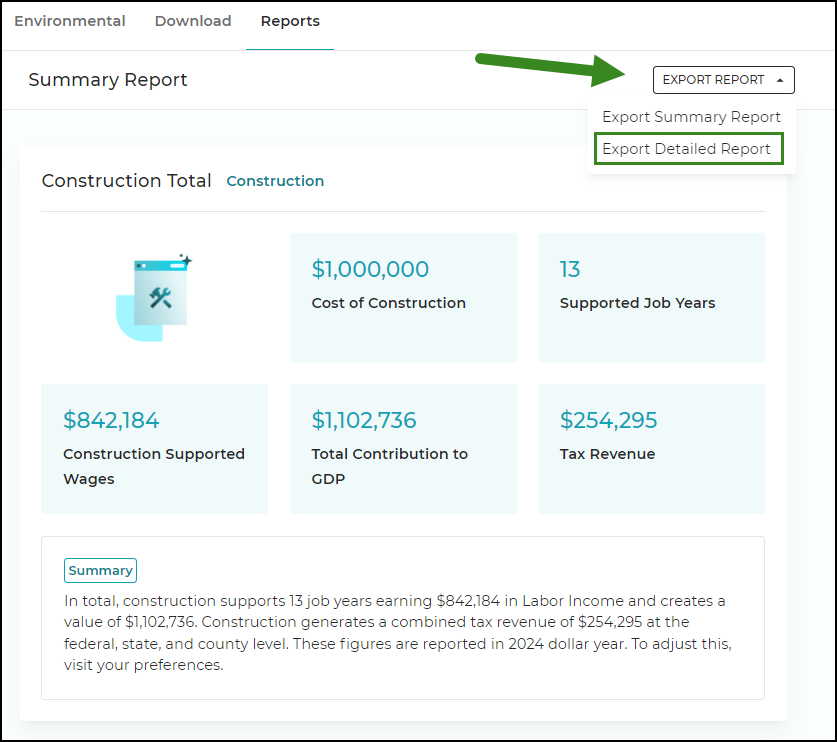
After completing the steps in the guide, users will be taken to the Summary Report Dashboard on the Results Page. This Dashboard will show the Results of the Event(s) with high level values, such as the Contribution to GDP and Tax Revenue. The report will also include a brief summary of the Results for the Event(s) modeled to help communicate the Results of the analysis to key stakeholders. This summary report can be exported to a PowerPoint by selecting Export Summary Report from the Export Report dropdown.
Additionally, users can export a detailed report into a Microsoft Word document by selecting Export Detailed Report from the Export Report dropdown. This document will include more context about IMPLAN model assumptions with highlighted Results, summary economic indicator Results, summary tax Results, and an appendix of IMPLAN terms. Note that this is currently available for the Construction and Operations, Impacts of Green Energy, Existing Firm/Industry Contribution, Tourism Impacts, University Impacts Guides, and Mixed Use Development Guide.
Enterprise Impacts Guide Results
Unlike the other guides, after completing the steps in the Enterprise Impacts Guide, users will be taken to the Report Map Embed Dashboard on the Results Page, instead of the Summary Report. The Report Map Embed Dashboard allows users to customize an interactive map that displays their results and then copy the map’s embed code to use it in their websites.
To customize the map, users can edit the map’s colors in the Map Styling bar, which can be matched to their branding. To edit the color of a map component, click the Edit color icon next to the component’s color swatch.
Users can select one of the 10 pre-configured colors by clicking on its swatch. A custom color can be added by inputting a hex code for the custom color in the Add Hex box.
After adding a hex code to the Add Hex box, a swatch for the color will appear next to it. To add the color, click Add.
After adding the color, the swatch for the custom color will appear in the Custom section. A user’s custom colors will be saved at the account level for use across all Enterprise Impacts Guide Projects.
Custom colors can be deleted, but the pre-configured colors cannot. To delete a custom color, select its swatch, then click the Delete button.
Click Reset to return all colors to their defaults.
Users can also utilize the Tags bar to select and deselect Event Tags to modify the Event results that are displayed in the map. To deselect an Event Tag, click the checkmark next to the Event Tag, then click Apply.
After customizing the map, users have the ability to copy the map’s code to embed the map in their websites by clicking Copy Embed Code in the Map Styling bar. This must be done after the customizations are completed.
To view the Summary Report Dashboard, users can click the Reports tab and then select Summary Report.
The Report Map Embed Dashboard is currently only available in the Enterprise Impacts Guide.
Find more information about the other Dashboards available on the Results Page here.
RELATED ARTICLES
Preparing and Entering Your Analysis
Written November 9, 2023
Updated April 3, 2025