INTRODUCTION
Multi-Regional Input-Output (MRIO) analysis makes it possible to track how an impact on any of the 528 IMPLAN Industries in a Region affects the production of all 528 Industries and household spending in any other region in the US. When using MRIO with Events in more than one Region, it can become difficult to understand how the filters will display Results. Here’s a guide on how to use the filters to see subsets of the Results for reporting purposes.
| Filter | Results Displayed (when set to "is equal to") |
| Region | Effects to the filtered Region(s) |
| Group Name | Effects due to the Events in the filtered Group(s) |
| Event Name | Effects due to the filtered Events(s) |
REGIONS & EVENTS
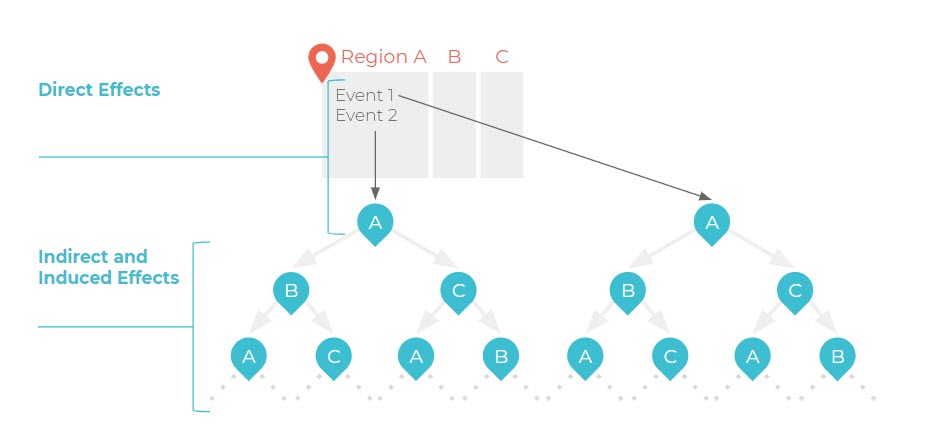
Let’s walk through an example with three Regions: A, B, and C. Here we have two Events generating Direct Effects to start; both in Region A. These Direct Effects in Region A created Indirect and Induced Effects in all three Regions as illustrated below.
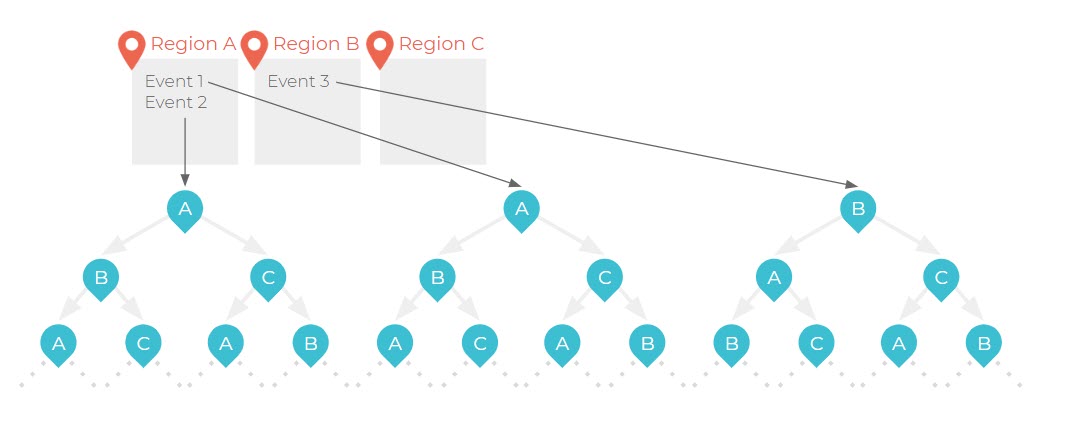
Using MRIO, users can have Events in more than one Region. This example shows how we have Direct Effects now in Region A (Event 1 and Event 2) and Region B (Event 3). Each of these three Events now yields Indirect and Induced Effects in all three Regions.
FILTERING MRIO RESULTS
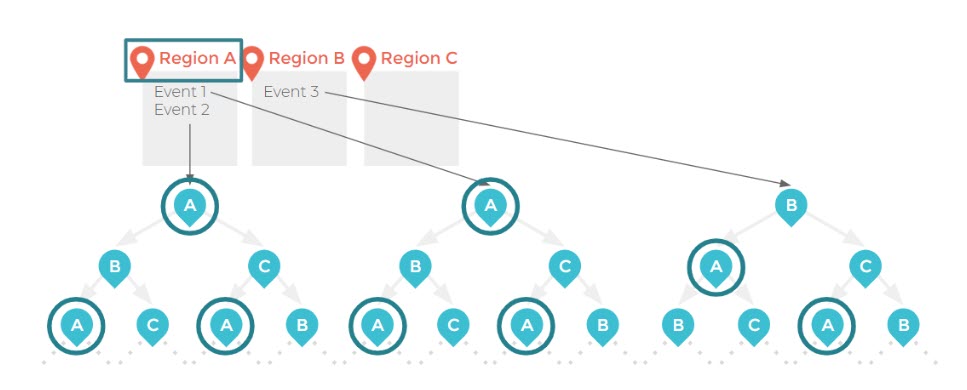
The Results screen by default loads with no filters applied and in the current Dollar Year (unless otherwise specified in the user preferences). Applying a Region filter for Region A, the Results will display the total Effects to Region A as a Result of the analysis. In this analysis there are three Events, two of which occur in Region A. Filtering by Region A in this analysis will display the resulting Effects to Region A due to all three Events in the analysis.
FILTER REGION A
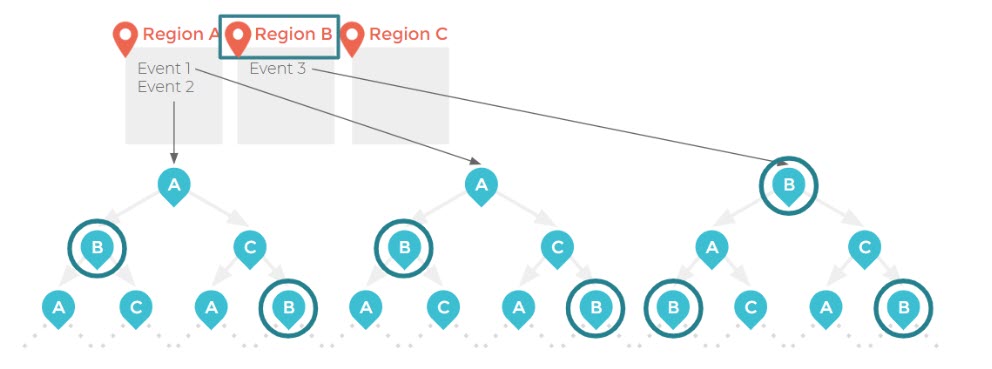
Removing the Region filter for Region A and replacing it with a filter for Region B, will display the total Effects to Region B due to all three Events in the analysis.
FILTER REGION B
Changing the Region filter to only include Region C will not yield a Direct Effect, as there was no Event that occurred in Region C. There will be, however, Indirect and Induced effects in Region C because of the three events.
FILTER REGION C
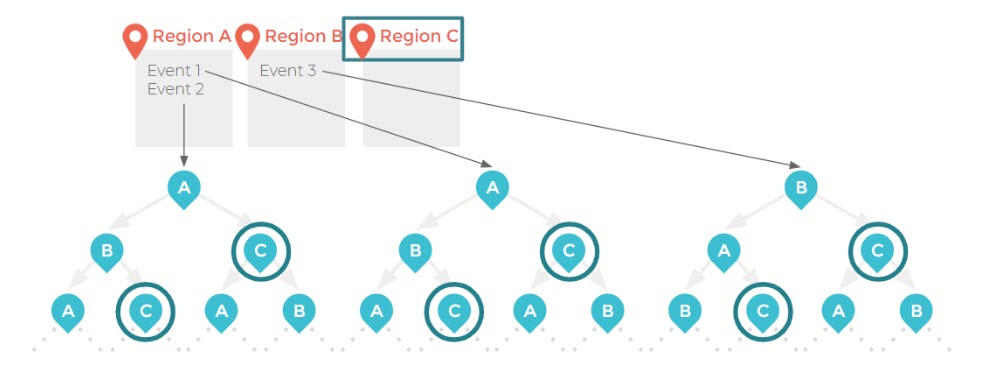
Removing the Region filter completely and choosing Event 1 from the Event filter, will display the total Effects of Event 1, in all three Regions.
FILTER EVENT 1

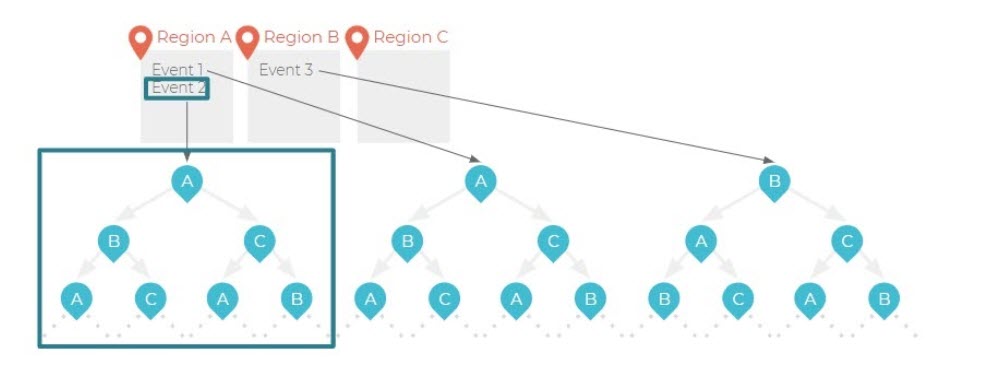
Applying the Event filter for only Event 2 will show the effects of only this Event in all three Regions.
FILTER EVENT 2
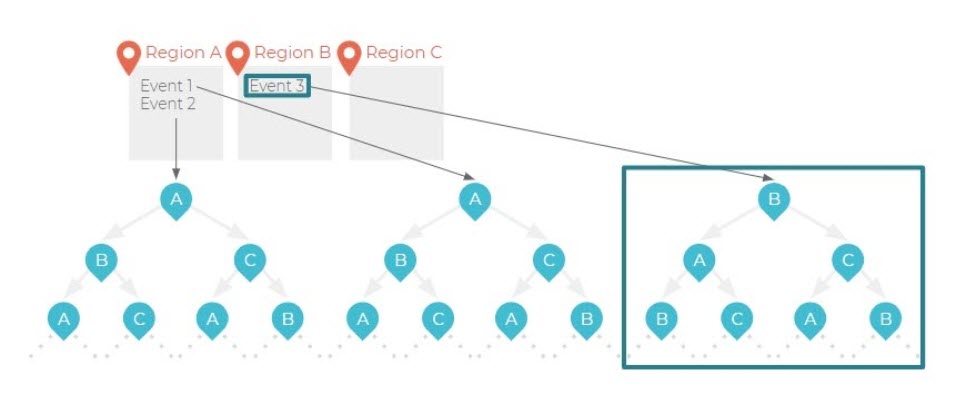
Applying the Event filter for only Event 3 will show the effects of only this Event in all three Regions.
FILTER EVENT 3
Removing all Event Name and Region filters while instead filtering on the Group Name for Group 1 will show the impact of every Event in this Group (in this example Group 1 includes Event 1 and Event 2) across all three Regions.
FILTER GROUP 1

Where things start to get complicated is when there are multiple filters applied at the same time. Users can filter for any number of Event Names, Group Names, or Regions simultaneously. Just be careful to ensure that filters are set on the correct items. In the example below, the filter was set for Event 1 and Region C. Therefore, we are only seeing the Effects of Event 1 on Region C.
FILTER EVENT 1 & REGION C

NOTE ON COMMODITY OUTPUT EVENTS
Whenever the LPP for a Commodity Output Event is set to anything other than 100%, IMPLAN will assume that the remainder, or 1-LPP, will be sourced in another Region. However, when utilizing an MRIO framework, it is possible that some of that value is sourced from another Region linked in the Project, and thus should be reflected as a Direct Effect in that Region.
However, this is not the current behavior in IMPLAN as these Direct Effects are being categorized as first-round Indirect Effects in the linked Region. This is a current limitation that the IMPLAN Product Team is working to resolve, but should be considered in any IMPLAN Project that utilizes Commodity Output Events with an MRIO setup.
RELATED ARTICLES
Updated August 30, 2023